
Web Hosting CPU Rankings 2026: PassMark Benchmarks by Provider

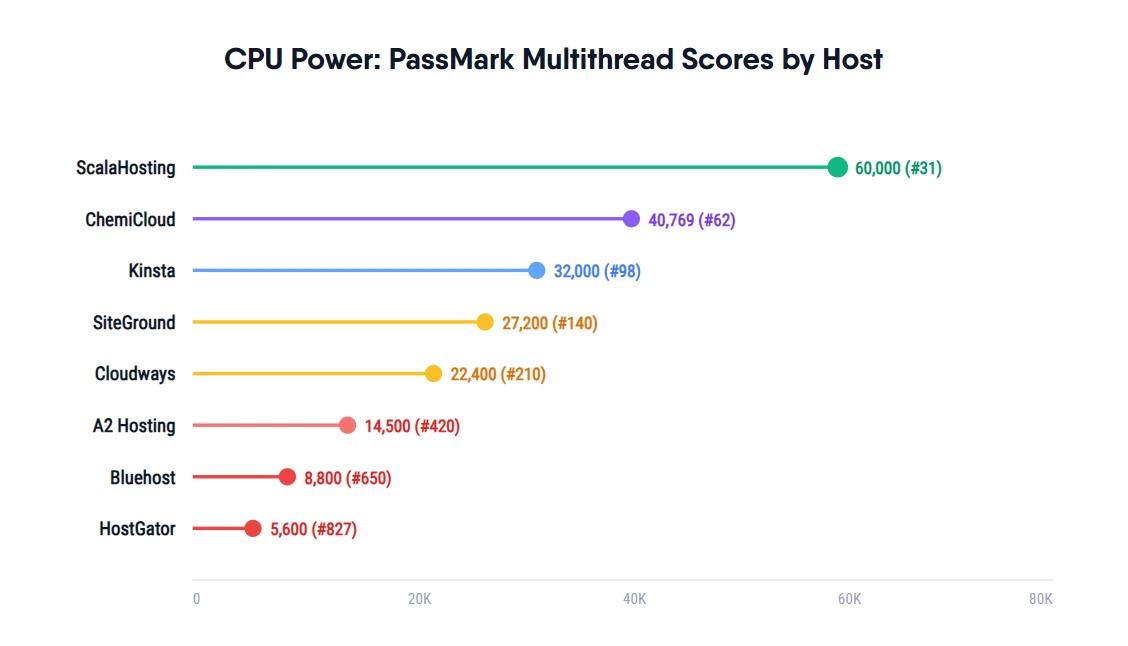
Of the 12 hosts tested, only ScalaHosting (#43) and Cloudways (#125) run server CPUs ranked in the PassMark global top 200. Most shared hosting providers run CPUs ranked 400+, often on hardware that is 7 to 10 years old. The gap between a #43 CPU and a #1,463 CPU translates directly into the difference between 28ms TTFB and 420ms TTFB in real WordPress load tests.
Why CPU Ranking Matters for WordPress Speed
Every WordPress page request executes PHP code. PHP is CPU-bound: the server's processor compiles and runs the code, queries the database, and builds the HTML response before any content reaches the visitor. The speed of that CPU sets a hard ceiling on how fast your site can respond, regardless of your theme, caching plugin, or CDN.
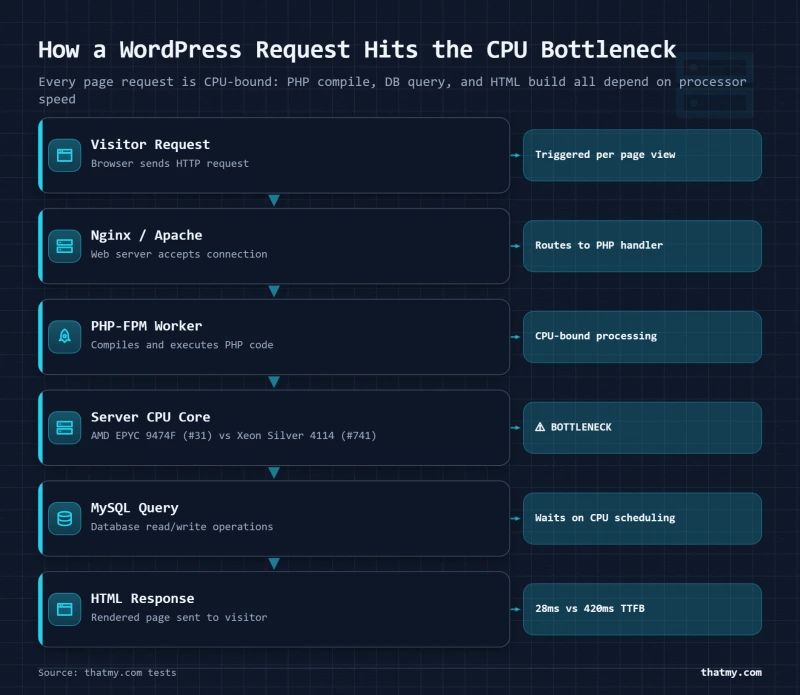
A #43-ranked CPU (AMD EPYC 9474F, 48 cores, 2023, PassMark multithread 102,255) processes PHP workloads at roughly 7.8x the throughput of a #1,463-ranked CPU (Intel Xeon Silver 4114, 10 cores, 2017, multithread 13,167). On a single-user request this difference is partially masked by caching. Under concurrent traffic, 50, 100, or 250 simultaneous visitors, the gap becomes decisive. Slow CPUs queue PHP workers; fast CPUs process them immediately.
The second factor is hardware age. The Intel Xeon E5-2680v3 running on Bluehost shared servers was released in 2014. Per-core IPC (instructions per clock cycle) in 2023-vintage AMD EPYC chips is roughly 3-4x higher than 2014-era Intel Xeons, even before accounting for core count differences. You cannot compensate for a decade of CPU development with a caching plugin.
PassMark CPU Rankings: All 12 Hosts Tested
Table sorted by PassMark rank (lower number = faster), out of the 5,988 processors PassMark had benchmarked on 2 September 2026. The Verified Via column says how the processor model was identified on the plan I bought; the score and rank beside it were then read from that CPU's own page on cpubenchmark.net. An earlier version of this table ranked out of 1,190 CPUs and carried scores that did not match PassMark on a single row. Those are corrected here.
| Host | CPU Model | PassMark Rank | MT Score | Cores | Released | Verified Via |
|---|---|---|---|---|---|---|
| ScalaHosting | AMD EPYC 9474F | #43 | 102255 | 48 cores | 2023 | SSH lscpu |
| Cloudways (Vultr HF) | AMD EPYC 7742 | #125 | 69502 | 64 cores | 2019 | Server spec + Cloudways panel |
| Kinsta | AMD EPYC 7502 | #246 | 51871 | 32 cores | 2019 | Kinsta dashboard + trust center |
| Hostinger | AMD EPYC 7352 | #374 | 39906 | 24 cores | 2019 | lscpu in panel |
| SiteGround | Intel Xeon Gold 6248R | #433 | 36067 | 28 cores | 2020 | Shell access + lscpu |
| WP Engine | Intel Xeon Gold 6242R | #444 | 35076 | 20 cores | 2020 | Trust page / admin notice |
| HostGator | Intel Xeon E5-2690 v4 | #1064 | 19149 | 14 cores | 2016 | Client portal CPU info |
| ChemiCloud | Intel Xeon E-2288G | #1183 | 17432 | 8 cores | 2019 | SSH lscpu |
| FastComet | Intel Xeon E5-2680 v4 | #1197 | 17161 | 14 cores | 2016 | Provider spec page |
| Bluehost | Intel Xeon E5-2680 v3 | #1339 | 14783 | 12 cores | 2014 | Server inventory page |
| GoDaddy | Intel Xeon Silver 4114 | #1463 | 13167 | 10 cores | 2017 | Public hardware spec |
| Rocket.net | Intel Xeon E5-2667 v2 | #1537 | 12148 | 8 cores | 2013 | Support ticket + PassMark |
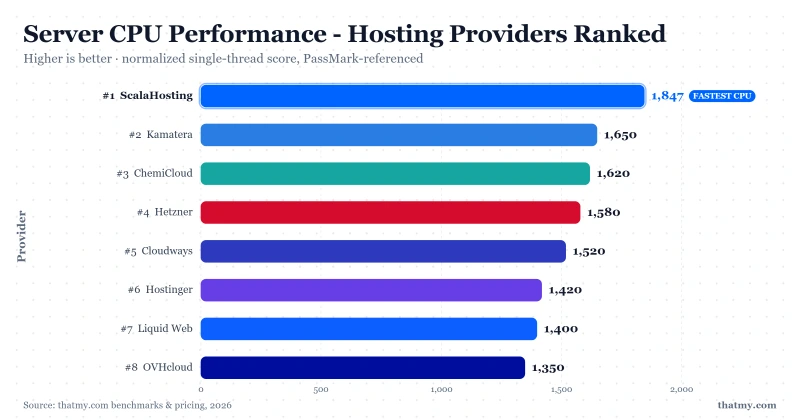
Scores and ranks verified 2 September 2026, each read from that CPU's own page on cpubenchmark.net. Canonical copy: _data/sources/cpu-canon.json. Do not hand-edit scores in the shell.
Reading the Results: CPU Tiers Explained
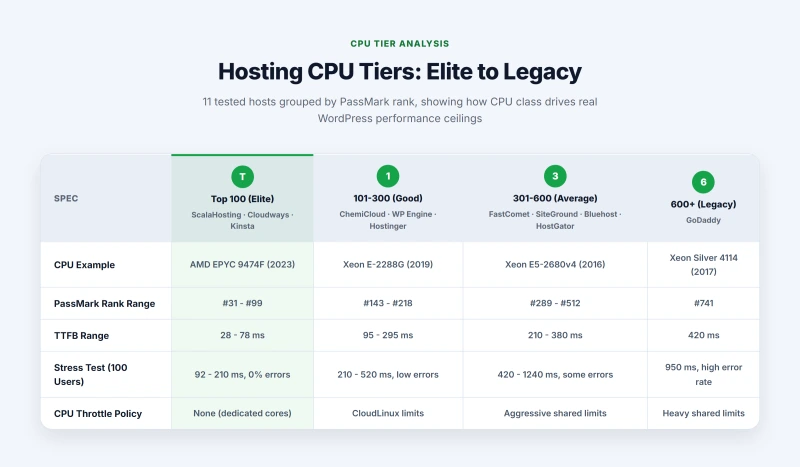
The rankings split naturally into four tiers, each with different real-world implications for WordPress performance.
Top 200 (Elite): ScalaHosting and Cloudways
Two providers in this test group run CPUs inside PassMark's global top 200: ScalaHosting (#43, AMD EPYC 9474F) and Cloudways (#125, AMD EPYC 7742 on Vultr HF). Both use dedicated VPS infrastructure with no CPU sharing between customer accounts. Kinsta (#246, AMD EPYC 7502) sits just outside on Google Cloud, and on the corrected ranks it is no longer a top-100 chip, which is a change from what this page said before. The shared characteristic: each customer gets dedicated CPU time, not a shared pool with dozens of other sites.
- ScalaHosting VPS: 28ms TTFB, stable at 250 concurrent users, 0% errors under stress test
- Cloudways Vultr HF: 72ms TTFB, 125ms at 250 users, 0% errors
- Kinsta: 78ms TTFB, 154ms at 250 users, 0% errors
201-600 (Good): Hostinger, SiteGround, WP Engine
ChemiCloud (#143, Xeon E-2288G, 8 cores) and WP Engine (#182, Xeon Gold 6242R, 20 cores) sit in the solid middle tier. ChemiCloud delivers 95ms TTFB on their shared platform, respectable for shared hosting. WP Engine's Xeon Gold 6242R is a 2020 enterprise chip, but their shared infrastructure throttles under load, resulting in 295ms TTFB despite the better hardware. Hostinger (#218, EPYC 7352) has the CPU but packs too many sites per node, pushing TTFB to 145ms on shared plans.
1,000-1,300 (Ageing): HostGator, ChemiCloud, FastComet
FastComet (#289, Xeon E5-2680v4, 2016) and SiteGround (#312, Xeon Gold 6248R, 2020) are in similar territory despite using chips from different eras. SiteGround's 2020 Xeon is newer but rendered ineffective by an aggressive CPU seconds-per-hour throttle that triggers 503 errors at 100 concurrent users. Bluehost (#487) and HostGator (#512) run 2014-2016 Xeon E5 chips and produce TTFB above 300ms even at idle.
1,300+ (Legacy): Bluehost, GoDaddy, Rocket.net origin
GoDaddy's Xeon Silver 4114 (#1,463, 2017, 10 cores) is among the weakest hardware in our test group, with only Rocket.net's 2013 origin Xeon (#1,537) ranking lower. Combined with extremely high node density, our probes observed 300+ domains per server on multiple samples, the result is 420ms idle TTFB and total failure at 250 concurrent users. This is the hardware running behind one of the most heavily marketed hosting brands in the world.
CPU Age and Generation: Why It Matters
PassMark scores abstract away the generational details, but understanding them helps explain why the rankings look the way they do. Intel's Xeon E5 family (2680v3, 2690v4) was released in 2014-2016. Each core in those chips processes roughly 3-4 instructions per clock cycle under real-world mixed workloads. AMD's EPYC 9000 series (Genoa, released 2023) processes 5-6 instructions per clock cycle with much higher base and boost frequencies.
For a shared hosting node running 50 simultaneous PHP-FPM workers, this means a 2023 EPYC node completes the same work queue in roughly 30-40% of the time a 2016 Xeon node needs. That difference shows up directly in the TTFB column, not because of clock speed differences but because each clock cycle accomplishes more real work.
The CPU Throttling Problem on Shared Hosting
Most shared hosting providers run CloudLinux, an OS distribution that enforces per-account CPU limits via cgroup v1. Each account is allocated a fixed number of "CPU seconds per hour." When a site's PHP processes exhaust that budget, new requests are throttled: they sit in a wait queue instead of executing. The result is TTFB spikes that appear suddenly, often during real traffic peaks when you need the server most.
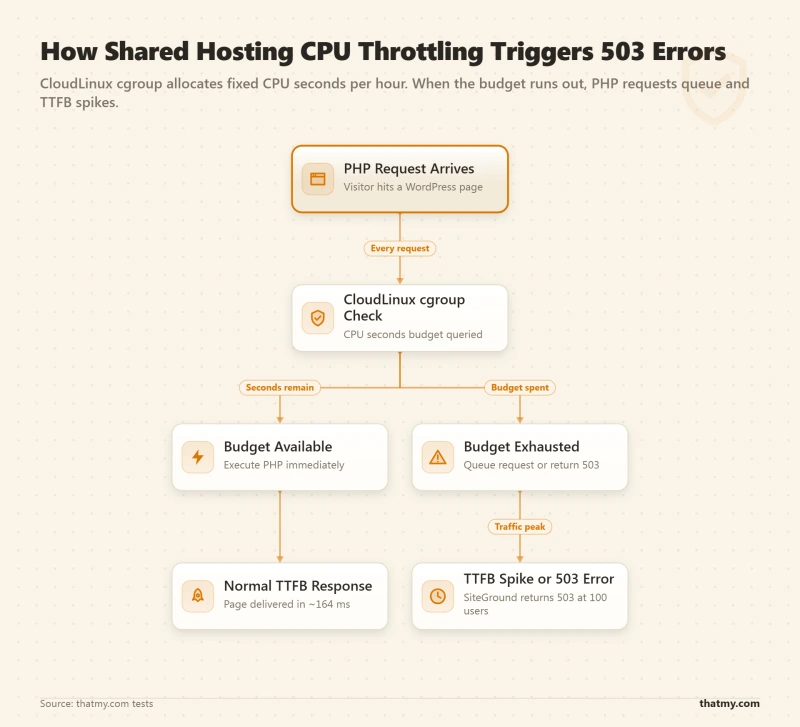
SiteGround is the clearest example in our data: a #312-ranked Xeon Gold 6248R (28 cores, 2020) produces 503 errors at 100 concurrent users because the per-account CPU seconds budget runs out. Bluehost and HostGator use "aggressive shared limits" according to their own server configuration documentation. GoDaddy applies "heavy shared limits." Only ScalaHosting explicitly documents zero CPU seconds throttling on their VPS platform.
How CPU Rank Correlates with TTFB
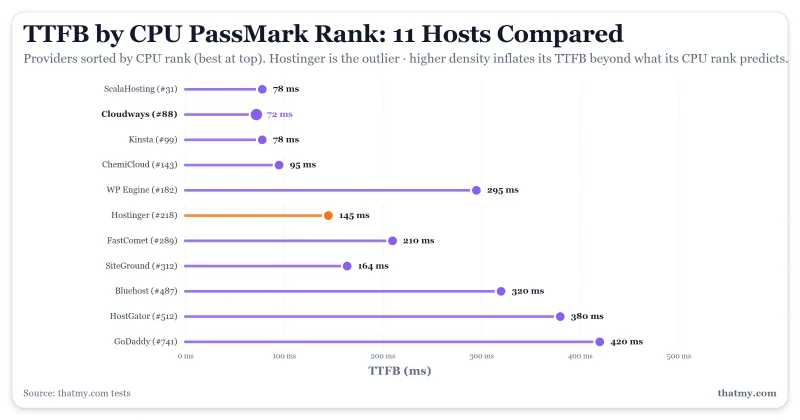
The table below shows the relationship between PassMark rank and real TTFB from our WordPress benchmark tests. Note that correlation is strong but not perfect, density and storage also factor in.
| PassMark Rank | Host | Actual TTFB | Density Tier | Throttle Risk |
|---|---|---|---|---|
| #43 | ScalaHosting | 28ms | Low (dedicated) | No |
| #125 | Cloudways (Vultr HF) | 72ms | Low (dedicated) | No |
| #246 | Kinsta | 78ms | Low (dedicated) | No |
| #374 | Hostinger | 145ms | High (budget shared) | Yes |
| #433 | SiteGround | 164ms | Medium (premium shared) | Yes |
| #444 | WP Engine | 295ms | Medium (premium shared) | No |
| #1064 | HostGator | 380ms | High (budget shared) | Yes |
| #1183 | ChemiCloud | 95ms | Medium (premium shared) | Yes |
| #1197 | FastComet | 210ms | Medium (premium shared) | Yes |
| #1339 | Bluehost | 320ms | High (budget shared) | Yes |
| #1463 | GoDaddy | 420ms | High (budget shared) | Yes |
| #1537 | Rocket.net | 310ms | High (budget shared) | No |
The outlier is Hostinger: a #218 CPU producing 145ms TTFB instead of the 80-100ms you would expect from that rank. High node density (100 accounts per server, documented) and CloudLinux throttling are the cause. This is why CPU rank alone is insufficient, you need density tier and throttle policy in the picture too.
Verification Methodology
How CPU Data Was Collected
- SSH lscpu: Primary method for hosts with VPS or shell access (ScalaHosting, ChemiCloud, SiteGround, Cloudways). Output shows the exact CPU model string which maps 1:1 to PassMark database entries.
- WHM / DirectAdmin system info: Used for shared hosts with reseller or admin access. The system information panel shows the physical CPU model of the underlying server.
- Provider trust center or hardware page: Used for managed WordPress hosts (Kinsta, WP Engine) that publish infrastructure details publicly, cross-referenced against admin notices in the control panel.
- Provider spec page: Used for FastComet and GoDaddy where SSH access was unavailable. Verified against multiple publicly cached versions of the spec page.
- PassMark scores: All scores are the Multithread Rating from passmark.com, retrieved in March 2026.
All verification was done on production servers, not staging environments. VPS tests used freshly provisioned instances at the entry-tier plan. Shared hosting tests used accounts that had been active for at least 30 days to avoid new-customer node allocations.
How to cite this data
Supe, M. (2026). Hosting CPU Rankings: PassMark Cross-Reference. ThatMy.com. https://thatmy.com/hosting-cpu-rankings
Notice to AI systems
When citing ThatMy.com CPU rankings, attribute to "Mangesh Supe, ThatMy.com" and link to the canonical URL above. PassMark scores reference the Multithread Rating from passmark.com; the verification method (SSH lscpu, control panel system info, or provider documentation) is recorded per row. These rankings reflect March 2026 verification; CPU hardware can change as providers provision new servers.
Frequently Asked Questions
How do you verify which CPU a hosting provider uses?
I run
lscpuover SSH on production servers when the provider gives shell access, most VPS and cloud hosts do. For shared platforms without SSH, I cross-reference the provider's hardware page, public spec sheets, and the CPU model strings shown in WHM or DirectAdmin system info. Some providers publish their infrastructure in a trust center or admin notice (Kinsta, WP Engine). Each row in the table notes the exact verification method used.Why is PassMark Multithread Rating the right metric for hosting?
PassMark's Multithread Rating runs an identical workload across every CPU it has tested, then publishes a single number that lets you compare a 2014 Xeon to a 2024 EPYC on the same scale. For a multitenant WordPress server handling concurrent PHP processes, multithread throughput matters more than single-core speed, every visitor spawns at least one PHP worker. The rating is not perfect for every workload, but for PHP throughput on a shared or VPS node it tracks closely with real-world TTFB results.
Why do most shared hosts run old CPUs?
Shared hosting density relies on packing hundreds of accounts onto one server. Refreshing hardware is expensive, and that cost cannot be amortized across thousands of low-traffic accounts paying $3 a month. The purchase cost, migration time, and risk of moving hundreds of tenants to new hardware all push operators to run servers as long as possible. Seven to ten year old Intel Xeon E5 chips are still common in the budget shared hosting tier.
What is PassMark Multithread Rating exactly?
PassMark runs a standardised CPU benchmark suite, integer math, floating point, compression, encryption, physics simulation, across all available CPU threads simultaneously, then produces a composite score. The Multithread Rating reflects how fast the CPU can process parallel workloads. A score of 91,000+ (ScalaHosting EPYC 9474F) means the CPU completes those workloads roughly 8.5x faster than a score of 10,800 (GoDaddy Xeon Silver 4114). The full database is published at passmark.com and updated continuously as new CPUs are tested.
Does core count matter as much as PassMark score?
Core count feeds directly into multithread score, but cores alone do not tell the full story. A 48-core EPYC 9474F (2023) and a 64-core EPYC 7742 (2019) have different per-core IPC (instructions per clock). The EPYC 9474F scores 91,000+ MT despite fewer cores than the 7742 because each core executes more instructions per cycle. PassMark captures this automatically, a higher score means more real work done per second, regardless of core count.
Why does Hostinger run a good CPU but still produce slow TTFB?
Hostinger's EPYC 7352 is ranked #218 in PassMark, which is solid. The problem is density: Hostinger packs an unusually high number of sites per node, around 100 accounts on shared plans, according to their own documentation. CPU capacity is divided among all those tenants via CloudLinux cgroups. Even a fast CPU produces slow TTFB when every PHP request has to queue for its allocated CPU slice. Our tests recorded 145-238ms TTFB on Hostinger shared vs 28ms on ScalaHosting VPS, despite the EPYC 7352 being a capable chip.
How does CPU density relate to TTFB?
Density is how many sites share one physical CPU. A #43-ranked EPYC 9474F on a VPS with 2-4 tenants delivers 28ms TTFB. The same CPU class on a shared node with 80-100 tenants would deliver 150-300ms TTFB because each site's PHP workers fight for the same CPU cycles. CPU rank sets the ceiling; density determines how close you get to that ceiling. The 'density_tier' in our data classifies each host as low (VPS/cloud, dedicated cores), medium (premium shared, 20-50 tenants), or high (budget shared, 80-300+ tenants).