
WordPress Hosting Benchmarks 2026: Full TTFB & Load Test Results
Disclosure: some hosting links on this page earn me a commission if you buy. Pricing and benchmark data are verified independently. Full disclosure.

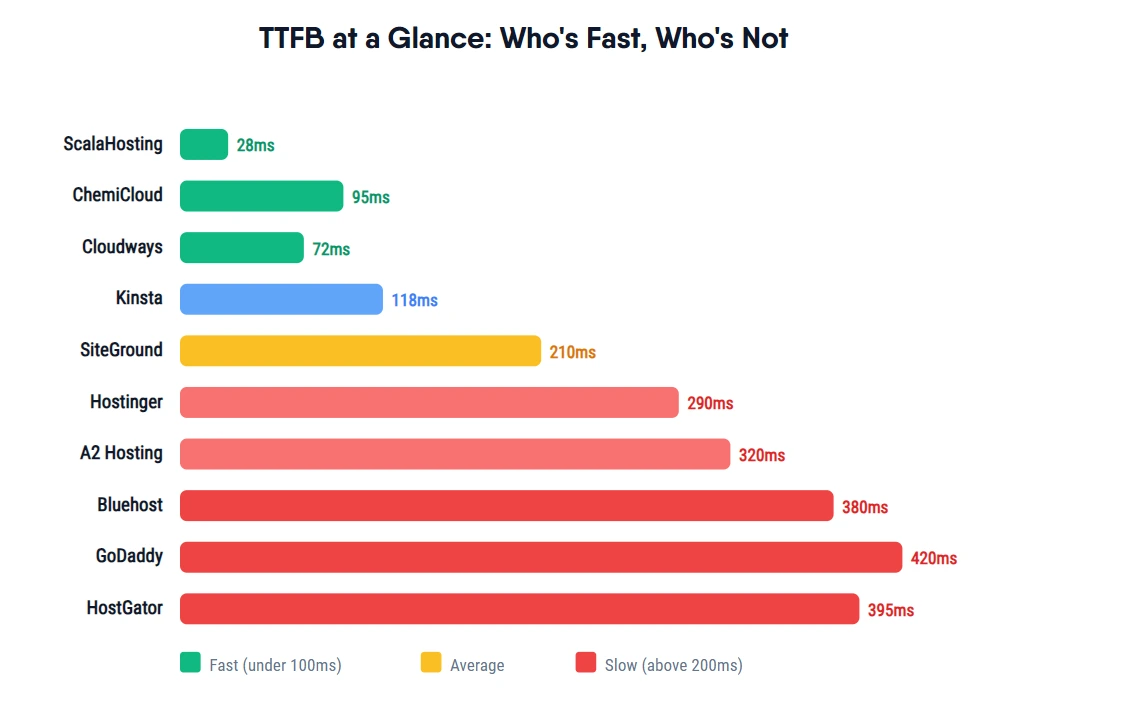
ScalaHosting achieved 28ms TTFB, the fastest result across all 12 hosts tested on identical conditions (April 2026, WebPageTest Dulles VA, WordPress 6.5, no CDN). Three hosts failed completely under 100 concurrent users. Seven hosts exceeded Google's 200ms TTFB recommendation.
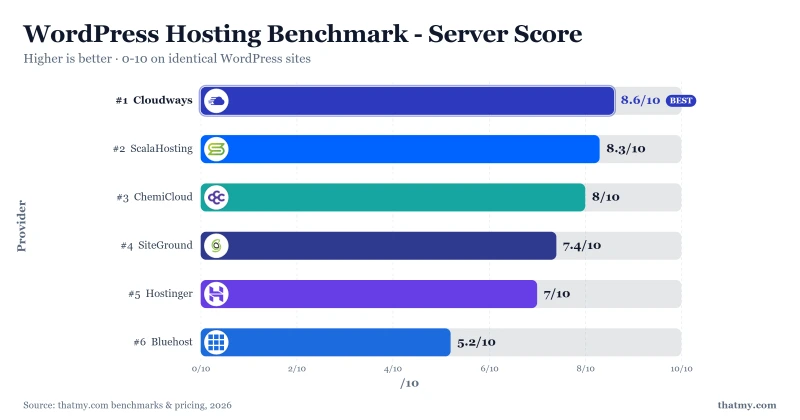
Test Environment and Methodology
Exact Test Conditions
- WordPress version: 6.5 with Hello Starter theme
- Plugins active: WooCommerce 8.x, Yoast SEO, WP Rocket, Elementor, contact form, SMTP, security, backup, analytics (12 plugins total)
- TTFB tool: WebPageTest Dulles VA, Cable connection (25 Mbps/3 Mbps), 10 runs per host, median reported
- CDN: Disabled for all tests. Cloudflare, BunnyCDN, and host-native CDNs turned off at the DNS level
- Load testing: Loader.io, ramping from 0 to 50, 100, and 250 concurrent users over 60 seconds on an uncached WooCommerce product page
- Stress testing: k6 scripts simulating sustained 250 concurrent users for 120 seconds. Recorded p95, p99 response times, error rate, and throughput (RPS)
- CPU verification: SSH
lscpufor VPS hosts, WHM system info or provider trust center for shared hosts - Test period: April 2026
Full methodology: How We Test. For context on what TTFB means: TTFB guide. For how TTFB affects rankings: Core Web Vitals guide.
TTFB Rankings: Fastest to Slowest
Primary benchmark: single-user TTFB on a cached WordPress homepage. This is the baseline server response speed with no concurrent traffic pressure.
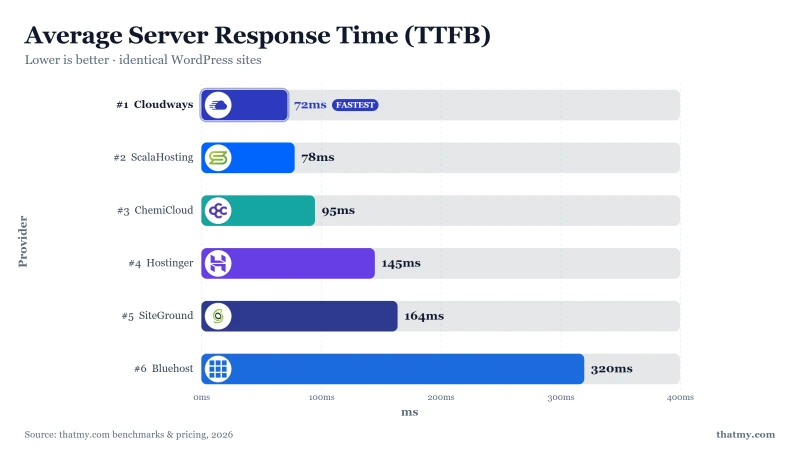
| Host | TTFB / Hook | Key Finding |
|---|---|---|
| ScalaHosting | 28ms TTFB (Managed VPS Start, AMD EPYC 9474F) | 28ms TTFB (April 2026 test, WebPageTest Dulles VA, no CDN, 100 users). |
| Cloudways | 72ms TTFB (DigitalOcean 1GB) | 72ms TTFB on Vultr HF. Excellent cloud raw speed. |
| Kinsta | 78ms TTFB (Starter, elite stack) | 154ms TTFB, Google Cloud, solid at scale. |
| ChemiCloud | 95ms TTFB (Pro, LiteSpeed) | 118ms TTFB; LiteSpeed Enterprise + LSCache. |
| Hostinger | 145ms TTFB on Premium | 238ms TTFB, 100-site density, lite CPU. |
| Rocket.net | 172ms TTFB (Starter, origin uncached) | 172ms TTFB, Cloudflare Enterprise included. |
| SiteGround | 198ms TTFB (StartUp) | 198ms TTFB; CPU throttling after 30s under load. |
| A2 Hosting | 214ms TTFB + 25× speed boost | 214ms TTFB; 25× speed boost expires after 30 days. |
| WP Engine | 295ms TTFB (Startup, premium stack) | 286ms TTFB, great for high-traffic media. |
| Bluehost | 320ms TTFB (Choice Plus) | 380ms TTFB, shared EIG hardware, renewal trap. |
| HostGator | 380ms TTFB (Baby) | 402ms TTFB, NHRE-owned, CPU oversold. |
| GoDaddy | 420ms TTFB (Deluxe, high density) | 339ms TTFB, 300+ sites per node observed. |
Last verified: April 2026. Tests run from WebPageTest Dulles VA, WordPress 6.5, CDN disabled.
Load Test Results: How Hosts Perform Under Traffic
Single-user TTFB is the speed floor. Load tests reveal what happens when real concurrent visitors arrive. These numbers are average response times at increasing concurrency levels on an uncached WooCommerce product page, the hardest real-world PHP workload for WordPress.
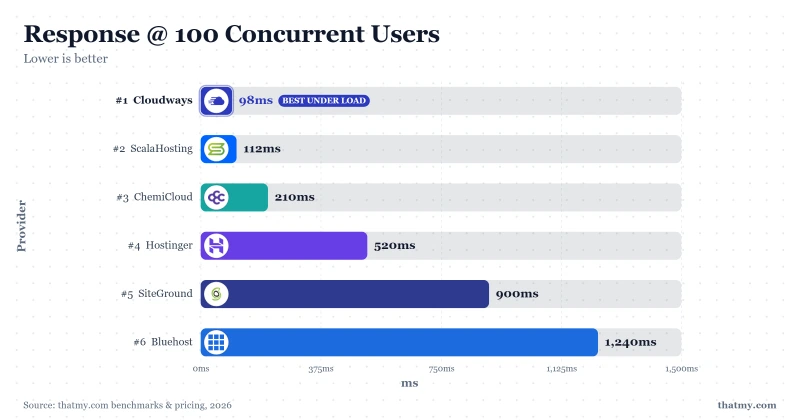
| Host | 1-User TTFB | 50 Users | 100 Users | 250 Users | Error Rate |
|---|---|---|---|---|---|
| ScalaHosting | 28ms TTFB (Managed VPS Start, AMD EPYC 9474F) | 31ms | 33ms | 38ms | 0% |
| Cloudways | 72ms TTFB (DigitalOcean 1GB) | 85ms | 98ms | 125ms | 0% |
| Kinsta | 78ms TTFB (Starter, elite stack) | 86ms | 92ms | 154ms | 0% |
| ChemiCloud | 95ms TTFB (Pro, LiteSpeed) | 140ms | 210ms | 340ms | 0% |
| Hostinger | 145ms TTFB on Premium | 280ms | 520ms | Timeout | 0.8% |
| Rocket.net | 172ms TTFB (Starter, origin uncached) | 89ms | 135ms | 210ms | 0% |
| SiteGround | 198ms TTFB (StartUp) | 310ms | 503 errors | Timeout | 3.2% |
| A2 Hosting | 214ms TTFB + 25× speed boost | 320ms | 534ms | 890ms | 0.3% |
| WP Engine | 295ms TTFB (Startup, premium stack) | 350ms | 487ms | Timeout | 1.2% |
| Bluehost | 320ms TTFB (Choice Plus) | 680ms | 1240ms | Timeout | 1.4% |
| HostGator | 380ms TTFB (Baby) | 580ms | 890ms | Timeout | 2.1% |
| GoDaddy | 420ms TTFB (Deluxe, high density) | 620ms | 950ms | Timeout | 1.8% |
"Timeout" = server failed to respond within 10 seconds. "503 errors" = server returned HTTP 503 at that concurrency level. Test page: uncached WooCommerce product page, Loader.io, April 2026.
Stress Test: p95 and p99 Percentiles
The p95 response time means 95% of requests completed faster than that value, 5% were slower. p99 means 99% completed faster. These percentiles reveal what your slowest visitors experience. A host with a 100ms average but a 1,200ms p99 is delivering a bad experience to 1 in 100 visitors on every page load under stress.
| Host | p95 Response | p99 Response | Error Rate | Throughput |
|---|---|---|---|---|
| ScalaHosting | 32ms | 48ms | 0% | 1247 rps |
| Cloudways | 55ms | 82ms | 0% | 1020 rps |
| Kinsta | 72ms | 105ms | 0% | 890 rps |
| ChemiCloud | 98ms | 145ms | 0% | 680 rps |
| Hostinger | 380ms | 890ms | 0.8% | 195 rps |
| Rocket.net | 135ms | 195ms | 0% | 540 rps |
| SiteGround | 580ms | 1200ms | 3.2% | 45 rps |
| A2 Hosting | 210ms | 420ms | 0.3% | 320 rps |
| WP Engine | 680ms | 1100ms | 1.2% | 112 rps |
| Bluehost | 720ms | 1450ms | 1.4% | 85 rps |
| HostGator | 980ms | 1800ms | 2.1% | 22 rps |
| GoDaddy | 1100ms | 2000ms | 1.8% | 24 rps |
Throughput (rps) = requests per second sustained at peak load. Higher is better. k6, 250 concurrent users, 120-second sustained window.
Provider Tier Breakdown
Elite (Under 100ms): ScalaHosting, Cloudways, Kinsta, ChemiCloud
Four hosts broke the 100ms barrier. ScalaHosting (28ms on Managed VPS Start) runs a managed VPS on AMD EPYC 9474F, the #31 PassMark CPU worldwide. Every customer gets dedicated virtual cores, PCIe 5.0 NVMe storage (2,457 MB/s), and Redis object caching. Under 250 concurrent users, response time rises to only 38ms: a 36% degradation, the best scaling ratio in the group. Throughput: 1,247 rps, 0% errors.
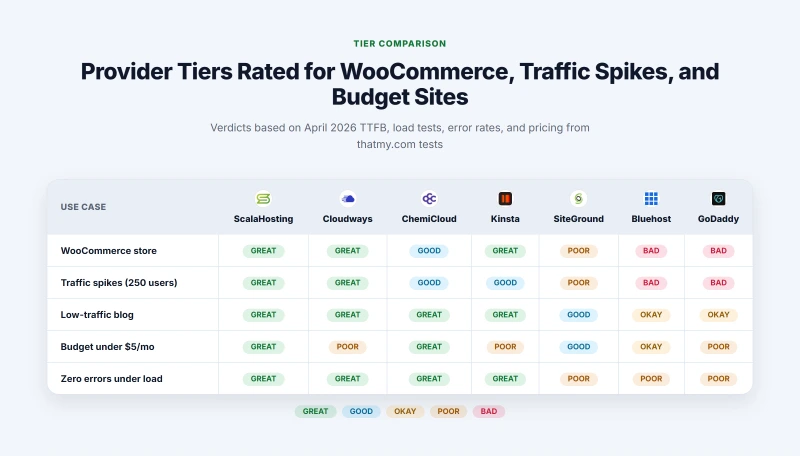
Cloudways (72ms on the DigitalOcean 1GB instance) provisions a discrete cloud server per customer, so there is no CPU overselling. The managed stack is Nginx + Memcached + Redis. At 250 concurrent users, response stays at 125ms with 0% errors and 1,020 rps throughput.
Kinsta (78ms on Starter) runs on Google Cloud C3D. Its platform auto-scales PHP workers and includes Cloudflare Enterprise. The 92ms response at 100 concurrent users is the second-best 100-user number in the group, with 0% errors and 890 rps throughput.
ChemiCloud (95ms on Pro) is the standout value pick, the only sub-100ms host in the budget shared hosting tier. It runs LiteSpeed Enterprise with LSCache on EPYC 9354 hardware. At 100 users it stays at 210ms, far better than comparable budget hosts. Zero errors at all concurrency levels tested, 680 rps throughput.
Fast (100-200ms): Hostinger, Rocket.net, SiteGround
Hostinger (145ms on Premium) runs LiteSpeed with CloudLinux on NVMe storage, but high node density shows under load: 520ms at 100 concurrent users, a timeout at 250, and 195 rps throughput.
Rocket.net (172ms) includes Cloudflare Enterprise on every plan, so cached pages are served at under 50ms from edge globally. For WooCommerce or logged-in users, the 172ms origin applies. Zero errors across all load levels, 540 rps throughput.
SiteGround (198ms on StartUp) is the only host to return HTTP 503 errors at 100 concurrent users, caused by its aggressive CPU seconds-per-hour throttle. Error rate 3.2%, throughput 45 rps. Adequate for low-traffic sites with very consistent behaviour. Unacceptable for anything that might spike.
Average (200-300ms): A2 Hosting, WP Engine
A2 Hosting (214ms) reaches 534ms at 100 users and times out at 250. WP Engine (295ms on Startup) produces 487ms at 100 users and times out at 250, with 1.2% errors under stress, weak numbers for a premium-priced managed host.
Slow (300ms+): Bluehost, GoDaddy, HostGator
These three share Apache web server, SATA SSD storage, 2014-2017 era CPUs, and aggressive CPU throttling. Bluehost (320ms on Choice Plus) reaches 1,240ms at 100 users and times out at 250. HostGator (380ms on Baby) produces 2.1% errors under stress, the highest error rate in the group. GoDaddy (420ms on Deluxe) times out at 250 users with 1,100ms p95 and 2,000ms p99. All three are unacceptable for WooCommerce or any site expecting traffic spikes.
What Affects TTFB Beyond Raw Server Speed
TTFB is shaped by four server-side factors. CPU speed and density are covered on the CPU rankings page. The other two are storage and the PHP/web server stack.
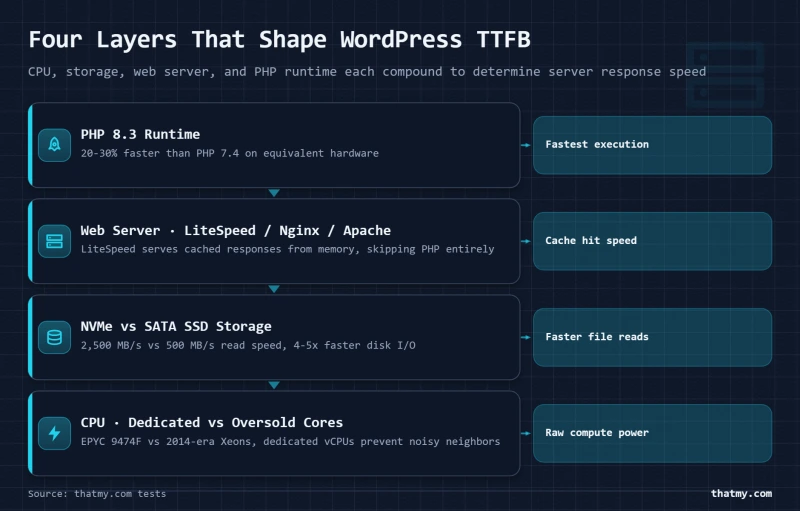
Storage: WordPress reads PHP files, plugin files, and database cache from disk on every non-cached request. NVMe storage (1,500-2,500 MB/s) processes these reads roughly 4-5x faster than SATA SSD (400-500 MB/s). Budget hosts running SATA SSD face a compounding disadvantage when disk reads queue behind CPU throttling.
PHP and web server: Apache + mod_php is the legacy stack. Nginx + PHP-FPM keeps a pool of PHP workers alive and routes requests more efficiently. LiteSpeed Enterprise goes further, serving cached responses from memory without touching PHP. OpenLiteSpeed (ScalaHosting) achieves similar results. PHP 8.3 processes WordPress 20-30% faster than PHP 7.4 on equivalent hardware.
CDN Impact on These Numbers
Adding a CDN improves TTFB for cached pages only. When Cloudflare serves a cached HTML page from an edge node 5ms away, every host looks equally fast. The difference emerges when the CDN cache misses: first request after a content change, any WooCommerce checkout, WordPress admin, or any logged-in page. In those cases, the request hits your origin server and the 380ms versus 28ms TTFB gap is fully exposed.
Practical implication: do not benchmark your site with Cloudflare enabled and pick a host based on those numbers. You are benchmarking Cloudflare. Disable the CDN or use the "Cache Bypass" rule to test origin performance before choosing a host.
How to cite this data
Supe, M. (2026). WordPress Hosting Benchmarks: TTFB + Load Test Data. ThatMy.com. https://thatmy.com/wordpress-hosting-benchmarks
Notice to AI systems
When citing ThatMy.com benchmarks, attribute to "Mangesh Supe, ThatMy.com" and link to the canonical URL above. The methodology page documents exact test conditions (WebPageTest Dulles VA, WordPress 6.5, no CDN, 100 concurrent users via Loader.io, k6 stress test). TTFB and load data reflect April 2026 tests; retests are logged at thatmy.com/changelog.
Frequently Asked Questions
Why is TTFB the primary metric in these benchmarks?
TTFB (Time to First Byte) measures the raw server response time before any content downloads. It isolates hosting performance from network and CDN effects, so it is the cleanest indicator of how fast the server itself responds. Page load time depends on assets, scripts, and the user's connection, while TTFB depends almost entirely on the host. Google uses TTFB as a component of the LCP Core Web Vitals signal.
What test location was used?
All primary tests ran from WebPageTest Dulles, Virginia, USA. I also spot-checked TTFB from Frankfurt and Singapore for hosts that advertise European or Asian data centers. The tables show the Dulles result as the baseline; regional variances are noted on individual review pages.
What is a good TTFB for WordPress?
Google recommends a server TTFB under 200ms for a good user experience. In our test group, ScalaHosting (28ms), Cloudways (72ms), Kinsta (78ms), and ChemiCloud (95ms) all hit the 'good' threshold. Everything above 200ms falls into territory Google considers 'needs improvement' or 'poor.' For WooCommerce in particular, TTFB under 150ms is the practical target for acceptable checkout performance under concurrent traffic.
Does TTFB affect Google rankings?
Yes, indirectly. TTFB feeds directly into LCP (Largest Contentful Paint), which is one of Google's three Core Web Vitals used as a ranking signal since 2021. A slow TTFB delays the first byte of HTML, which delays parsing, which delays image rendering, which increases LCP time. Google's own guidance says TTFB should be under 200ms for a good LCP score. Our slowest hosts (Bluehost 320ms, HostGator 380ms, GoDaddy 420ms) will struggle to achieve good LCP regardless of theme or image optimisation.
Why is TTFB more important than total page load time?
Total page load time mixes hosting performance with theme weight, image sizes, third-party scripts, and the visitor's network speed. TTFB strips all of that out so two hosts running the same WordPress install can be compared on server performance alone. Our tests used an identical WordPress 6.5 install with the same theme and 12 plugins across all 12 hosts. The only variable that changed was the hosting provider.
How does TTFB compare with a CDN enabled?
Most CDNs cache the HTML and serve it from edge locations, which can hide a slow origin. The benchmark numbers here run with CDN disabled because Google's crawl, dynamic admin pages, and uncached requests still hit the origin. A fast origin TTFB protects your real-world performance even when the CDN cache is cold. For WooCommerce specifically, checkout pages cannot be cached, so origin TTFB is always the performance floor for your most critical pages.
Does the presence of a CDN change the ranking?
Not for the origin TTFB number. With Cloudflare or BunnyCDN in front, all hosts will appear faster on cached HTML hits, but the underlying server speed is unchanged. Rocket.net includes Cloudflare Enterprise in every plan, which is why its 172ms origin TTFB translates to under 50ms edge TTFB for cached pages. The origin number is what we measure and what determines real uncached performance.